Effective Ways to Find Cumulative Frequency in 2025
Cumulative frequency provides valuable insights for data analysis and statistics, making it an essential tool for understanding how data points accumulate across defined intervals or classes. This article explores the latest techniques for calculating and visualizing cumulative frequency in 2025, equipping researchers and students with the necessary methods and statistical tools to analyze their data more effectively. Whether you’re dealing with continuous or discrete data, mastering cumulative frequency can enhance your data interpretation skills significantly.
Cumulative Frequency: Understanding the Concept
To define **cumulative frequency** accurately, it is important to understand how it relates to **frequency distribution**. Cumulative frequency is obtained by summing the frequencies of each class interval in a data set up to the current point. This provides a running total of frequencies, illustrating the distribution of data. By calculating cumulative frequency, researchers can enhance their **data visualization** and more readily interpret trends and patterns in their data, aiding in effective decision-making and hypothesis testing.
Defining Cumulative Frequency
Cumulative frequency can be succinctly defined as the total number of observations in a dataset that lie within or below each class or interval. The formula for calculating this is straightforward:
Cumulative Frequency (CF) = Frequency (f) + CF of previous class. For instance, in a frequency distribution of test scores, if the first class (50-59) has a frequency of 5 and the second class (60-69) has a frequency of 10, the cumulative frequency for the second class is 15. Utilizing this method, analysts can organize data systematically, leading to better data management and understanding of trends.
Cumulative Frequency Formula
The **cumulative frequency formula** is a fundamental aspect of data analysis, especially for researchers dealing with **grouped data**. In short, the formula used is as follows:
– For the first class, CF = Frequency of first class
– For subsequent classes, CF = (Frequency of current class) + (Cumulative Frequency of previous class)
This clarity allows for better **data interpretation** and prepares researchers for creating cumulative frequency tables or graphs that enhance statistical visualization.
Calculating Cumulative Frequency: Techniques and Tips
Calculating cumulative frequency can appear daunting, but there are effective techniques that simplify the task. This section will detail various methods, providing both step-by-step guides and practical examples related to **calculating cumulative frequency** using statistical tools or spreadsheets like Excel, as well as manual methods.
Using Excel for Cumulative Frequency Calculation
Calculating **cumulative frequency in Excel** can streamline the process, especially with large datasets. Simply follow these practical steps:
- Input your data in a single column.
- Next, use the SUM function in a new column to calculate cumulative frequencies: for example, select the cell adjacent to your first frequency value and enter =SUM($A$1:A1) to encapsulate the preceding values.
- Drag this formula down to fill it across all data entries. This will give you a running total of frequencies, effectively allowing for the analysis of cumulative frequency data.
By using Excel’s functionalities, analysts are able to significantly enhance **data transformation** and streamline their statistical computations.
Manual Calculation Techniques
For those who prefer a more hands-on method, calculating cumulative frequency manually can be quite insightful. Follow these steps:
- Organize your data into a frequency distribution table.
- For each class or interval, record the frequency count.
- Start from the first class and write down its frequency. Proceed to the next class; add the previous cumulative frequency to the current class’s frequency and write this down.
- Repeat this process for all classes until you’ve finished adding up all frequencies.
This manual approach not only reinforces your ability to perform thorough **frequency analysis techniques** but also enhances understanding through visual representation of cumulative data.
Visualizing Cumulative Frequency Data
Once cumulative frequency has been calculated, the next step is to visualize it effectively. Understanding how to create a **cumulative frequency graph** is essential for interpreting data patterns and trends effectively. This section explores methods to display cumulative frequency for better insight.
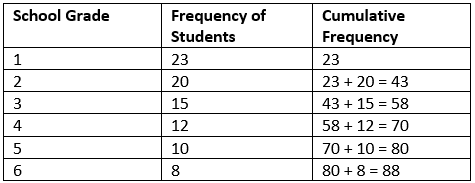
Creating a Cumulative Frequency Table
The first step in visualizing cumulative frequency is creating a **cumulative frequency table**. This table should list all class intervals alongside their respective cumulative frequencies, facilitating a clear view of data accumulation. For instance, if you have interval classes mapping score ranges for students, the cumulative table would help compare how many students scored below specific thresholds by the defined intervals.
Plotting Cumulative Frequency Graphs
After establishing the cumulative frequency table, the next logical step is plotting the values into a **cumulative frequency graph**. To do this:
1. On the x-axis, mark the class intervals, while the y-axis will reflect cumulative frequencies.
2. Plot each cumulative frequency point corresponding to its interval.
3. Connect these points with straight lines to form a polygon, typically referred to as a **frequency polygon**.
This visual representation allows for a remarkably clear depiction of **data trends**, simplifying interpretations related to shapes of cumulative frequency curves.
Applications of Cumulative Frequency in Research and Business
Cumulative frequency isn’t merely an academic tool; it holds significant applications in practical situations such as business analysis and educational contexts. This section highlights its practical applications and how to utilize **cumulative frequency** for effective data interpretation within various disciplines.
Cumulative Frequency in Educational Statistics
In educational statistics, cumulative frequency can play a crucial role in summarizing students’ performances in assessments. For instance, by plotting a cumulative frequency graph of test scores, educators can quickly determine how many students performed below a specific score, which supports targeted improvements in teaching strategies in line with **measures of central tendency**.
Cumulative Frequency in Business Analysis
Businesses can utilize cumulative frequency analysis to estimate customer behaviors and sales trends effectively. By analyzing cumulative frequency distributions of sales data, businesses can gather insights on volume distribution over time, optimizing inventory requirements, and offering targeted marketing strategies. Furthermore, better statistics supported by cumulative frequency can bolster hypothesis testing for market strategies.
Cumulative frequency methods drive empirical inquiries and powerful visualizations that enhance strategic development for organizations grounded in data science.
Key Takeaways
- Cumulative frequency provides a comprehensive understanding of frequencies across intervals.
- Utilizing Excel can greatly improve efficiency in calculating cumulative frequencies.
- Visual representation through cumulative frequency tables and graphs is essential for data interpretation.
- Effective applications are found not only in academia but also in business analytics for assessing trends.
- Understanding cumulative frequency aids in better report creation and clear communication of data insights.
FAQ
1. What is the importance of cumulative frequency in statistics?
Cumulative frequency is essential in statistics as it provides a running total that facilitates data interpretation by illustrating how data accumulates. This aids in visualizing distributions and determining thresholds for measured data sets effectively.
2. How are cumulative frequency tables created?
To create a cumulative frequency table, list the class intervals in one column, and alongside, calculate cumulative frequencies by summing frequencies incrementally from the frequency data for each class.
3. What tools can I use for cumulative frequency calculation?
You can utilize spreadsheet software like Excel for efficient cumulative frequency calculation, or perform manual calculations using paper and a calculator. Both methods ultimately lead to similar results but differ in efficiency.
4. How can cumulative frequency be applied in business strategies?
Cumulative frequency analysis helps businesses assess customer behaviors and sales patterns. This information can drive inventory decisions and tailor marketing strategies based on data insights relating to demand over time.
5. Can cumulative frequency be used for ungrouped data?
Yes, cumulative frequency can be calculated for ungrouped data by arranging the data in order and summing frequencies as you evaluate lower thresholds, though it is often more efficient for grouped data in representing larger datasets.
Through understanding and application, cumulative frequency remains a powerful tool in data interpretation, providing necessary insights in statistical and analytical tasks.

