How to Properly Find Domain and Range of a Graph
Understanding how to find the **domain** and **range** of a graph is crucial for analyzing mathematical functions. This guide will walk you through the practical steps to correctly identify these properties for various types of graphs in 2025. By the end of this article, you’ll have a solid grasp on graph analysis, including techniques for both continuous and discrete functions.
Understanding Domain and Range
The **domain** is defined as the set of all possible **x-values** (input values) of a function, while the **range** refers to the set of all possible **y-values** (output values) that result from applying those **x-values**. To identify the domain and range effectively, it’s important to understand **function properties** and the visual representation of the graph on the **Cartesian coordinates** system. For example, if a graph starts at a certain point and extends infinitely to the right, the domain is characterized as an **unbounded function**. On the other hand, if the graph has limits, then you’ll need to use **interval notation** to express those bounds accurately.
Using Graphical Methods
Graphical methods are often the easiest and most intuitive ways to determine the domain and range. When analyzing a function graph, you can visually assess where the plot is defined. For example, if the graph is continuous and smoothly defined throughout the x-values, its domain can be represented as a closed interval or open interval based on whether bounds exist. Similarly, evaluate the maximum and minimum points on the graph to understand the range. Note that when there are gaps or asymptotes in the graph, the **domain restrictions** must be acknowledged when determining valid **x-values**.
Vertical and Horizontal Line Tests
Two powerful tools for analyzing graphs are the **vertical line test** and the **horizontal line test**. The vertical line test helps confirm whether a relation is indeed a function by ensuring each **x-value** corresponds to only one **y-value**. If any vertical line intersects the graph more than once, it fails this test, indicating a non-function relation. Conversely, the horizontal line test determines if a function is one-to-one by checking if each **y-value** corresponds to only one **x-value**. Passing this test means the function can be inverted, providing insights into its mapping properties.
Calculating Domain and Range with Examples
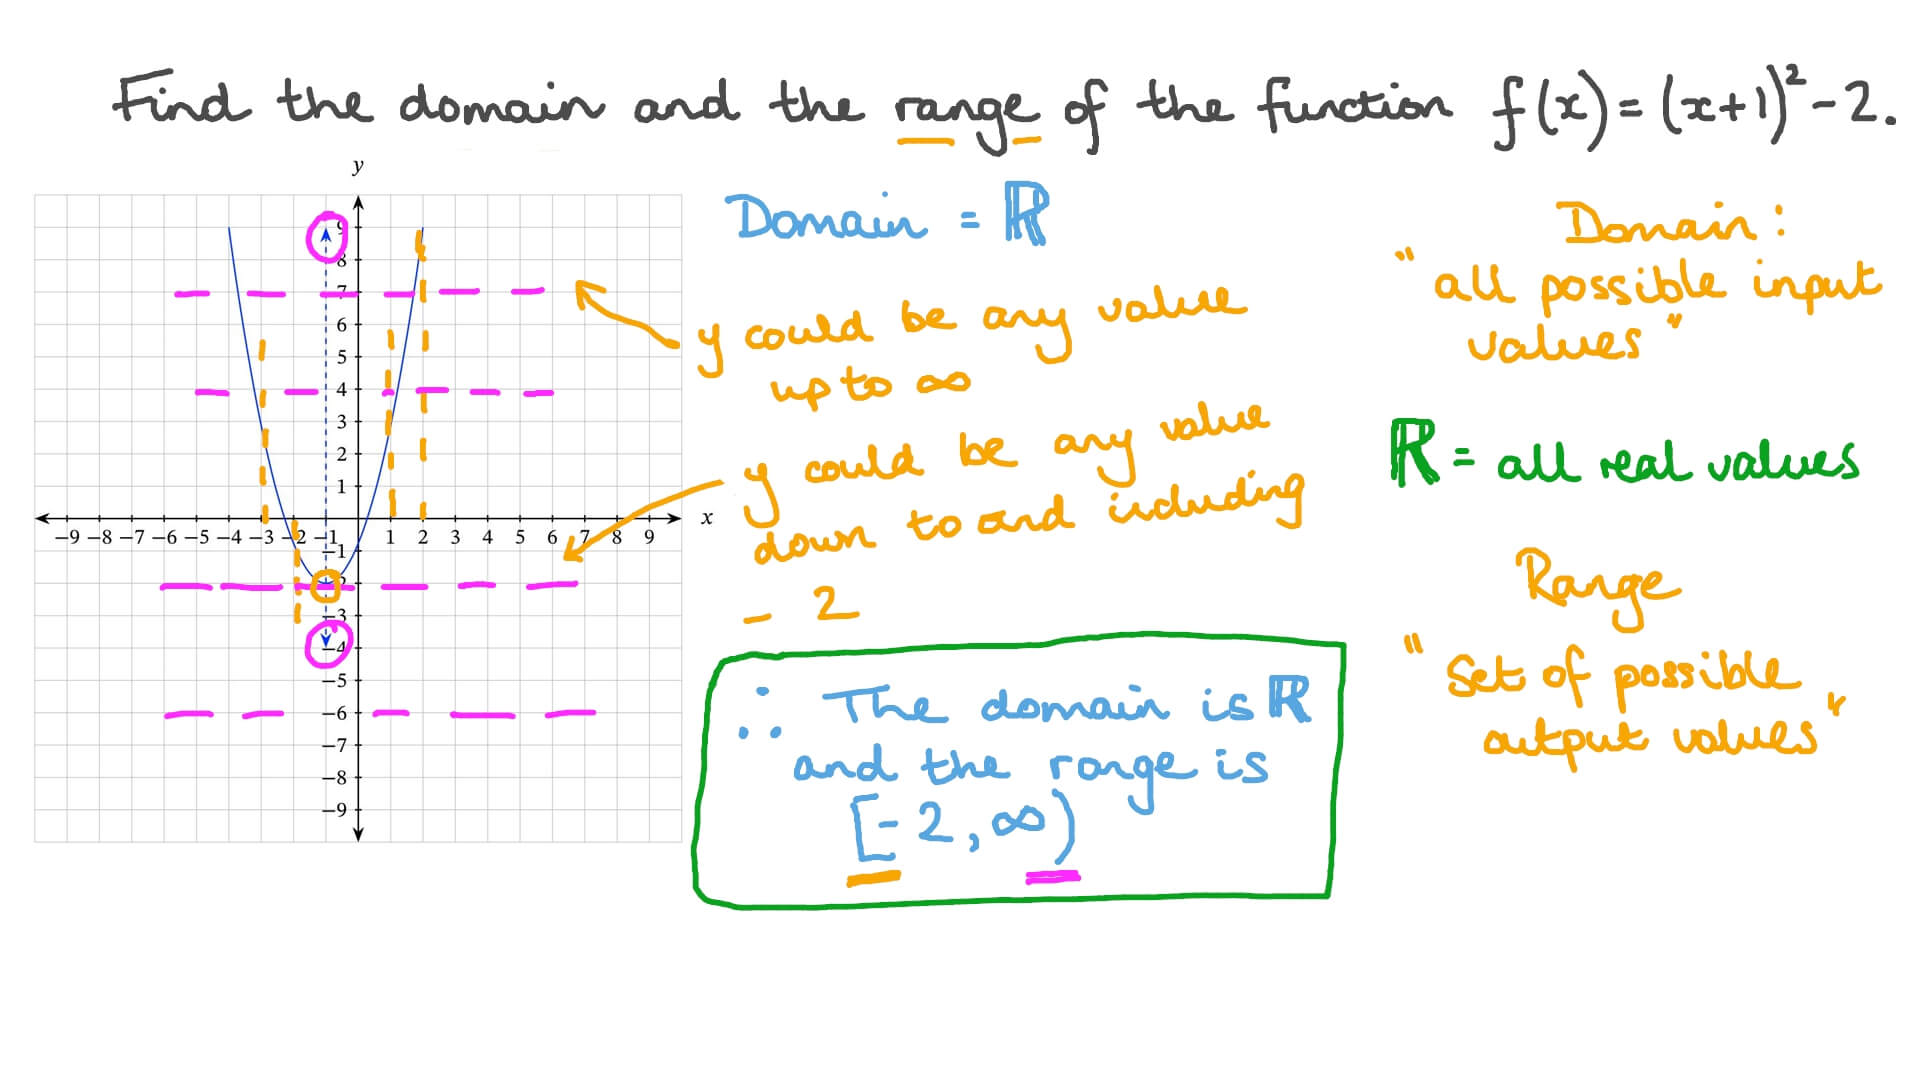
Practical examples are invaluable for solidifying the concepts of domain and range. Suppose you have a sample quadratic function, \( f(x) = x^2 – 4 \). The domain for this function is all real numbers, represented as \( (-\infty, \infty) \) since you can input any real number. The range, however, only includes values \( y \geq -4 \), since that is the vertex of the parabola where it reaches its minimum. The range can thus be expressed as \( [-4, \infty) \). Such calculations highlight how **transformation of graphs** can also affect the domain and range.
Piecewise Functions
Piecewise functions, where different rules apply to different intervals of the domain, can complicate domain and range analysis. For example, consider the piecewise function defined as:
\[
f(x) =
\begin{cases}
2x + 3 & \text{if } x < -1 \\
4 & \text{if } -1 \leq x < 2 \\
-x + 1 & \text{if } x \geq 2
\end{cases}
\]
For this function, the domain is \( (-\infty, -1) \cup [-1, 2) \cup [2, \infty) \), while the range spans \( [1, \infty) \). Analyzing such cases enhances understanding of the input-output relationship and stresses the importance of correctly interpreting functions graphically.
Assessing Open and Closed Intervals
When determining domain and range, distinguishing between **open intervals** and **closed intervals** is vital. A closed interval includes its endpoints (indicated with brackets, e.g., \( [a, b] \)), while an open interval excludes its endpoints (indicated with parentheses, e.g., \( (a, b) \)). For a function graph with defined endpoints and boundaries, like a quadratic that opens upwards and touches the x-axis at two points, understanding these distinctions supports accurate identification of domain and range using **set notation**.
Graphical Interpretation Techniques
Graphical interpretation is another critical aspect of finding the **domain** and **range**. By emphasizing the importance of graphical features—such as asymptotes, vertices, and **turning points**—you can refine your analysis of how a graph behaves under various inputs. For instance, a rational function with vertical asymptotes at \( x = 0 \) would indicate that the domain excludes this **x-value**, while approaching infinity may extend its range indefinitely. Understanding behavior at infinity helps to set proper limits on the output values.
Analyzing Trends
Identifying trends in graph behavior—including both increasing and decreasing behavior—is paramount in domain and range analysis. Continuous functions exhibit segments where they consistently increase or decrease, allowing for succinct characterization of both domain and range. For example, a function that continuously rises from \( -\infty \) to a maximum of \( 5 \) will have a range of \( (-\infty, 5] \). Knowing how to synthesize information from graph behaviors strengthens one’s analytical skills in mapping out comprehensive function properties.
Practical Applications and Limitations
When working with real-valued functions and understating their limitations, practitioners often encounter both challenges and opportunities when determining the domain and range. For instance, employing software tools for graphing can facilitate this process significantly, allowing for better visual cues and understanding of function properties. Yet, true analytical competency emerges when one can manage the intricacies of functions analytically—not just relying on technology but understanding the theory behind **function notation**, **continuity**, and the significance of graphical representation.
Key Takeaways
- Domain refers to the set of input values, while the range corresponds to the set of output values for target functions.
- Graphical methods and tests help ascertain whether a graph qualifies as a function based on behavior.
- Piecewise functions and understanding of intervals can complicate traditional domain and range calculations but offer unique insights.
- Continuous functions exhibit trends that simplify understanding of input-output relationships, enriching analytical skills.
- Combining both computational tools and theoretical knowledge creates a robust strategy for effective graph analysis.
FAQ
1. What is the significance of domain in function analysis?
The domain of a function denotes all permitted input values. Understanding domain is essential for analyzing the behavior of a function and ensuring that calculations lead to valid output values. Restrictions on the domain, such as asymptotes or values that yield undefined outputs, play a critical role in function analysis and graphical portrayal.
2. How do I determine if a relation is a function?
A relation can be classified as a function if every input value corresponds to exactly one output value. Utilizing the **vertical line test**, if a vertical line intersects the graph at more than one location, the relation is not a function. This test is foundational in determining function properties and understanding how **output evaluation** occurs according to given inputs.
3. What are piecewise functions and how do they impact domain and range?
Piecewise functions have different expressions based on specific intervals of the input domain. They can complicate analysis as each section of the domain may have unique characteristics, resulting in varied ranges. When evaluating piecewise functions, it’s important to individually assess each piece to holistically ascertain overall domain and range, captured via **set notation** or **interval representation**.
4. How can I visualize domain and range more easily?
Creating a mapping diagram can simplify visualizing domain and range. These diagrams graphically represent the input-to-output relationships, providing a clearer understanding of how each input correlates with its resulting output. Alternatively, plotting both domain and range sets graphically and labeling key features can further enhance comprehension.
5. Can all functions be represented in interval notation?
Most bolstered functions and continuous graphs can be described using interval notation, marking where the function reaches defined x or y-values precisely. However, for piecewise functions or those with undefined points, using set notation may be necessary to capture the full limitations of the domain and range effectively.