How to Effectively Find the Slope of a Graph in 2025: A Smart Guide to Success
Calculating the **slope of a graph** is a fundamental skill in mathematics, helping to understand relationships between variables. This guide will offer effective strategies and methods for finding the slope, including the **slope formula** and more techniques that will enhance your understanding of graphical representations. Whether you’re interested in linear relationships or the intricacies of graphs in various fields like physics or economics, mastering the slope calculation methods covered here will equip you for success.
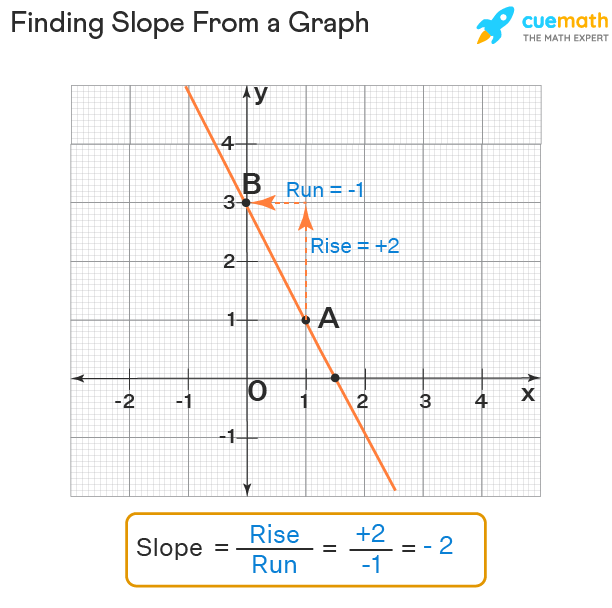
Understanding the Basics of Slope
To conceptualize **slope**, we first must grasp its definition. In mathematical terms, slope represents the measure of a line’s steepness, defined as the ratio of vertical change (rise) to horizontal change (run). The expectation is that as you rise vertically on the graph, how far do you run horizontally? The relationship is expressed through the **slope formula**:
Slope (m) = Rise / Run
For instance, in a **linear graph slope**, you may observe data that shows a consistent trend. A **positive slope** indicates that as one variable increases, so does the other, whereas a **negative slope** implies the opposite behavior. By understanding these basic concepts, you will be able to analyze slopes and investigate trends in graphs more effectively.
The Significance of Slope in Graph Analysis
Analyzing slopes is crucial in multiple academic fields and can reveal significant trends in data relationships. For instance, in physics, the slope in a distance-time graph indicates velocity, while in business analytics, it can illustrate market trends over time, helping analysts make predictions about future performance. The **gradient of a graph** can inform many real-life decisions ranging from finance to engineering, showcasing the importance of a solid understanding of slope calculation.
How to Calculate the Slope between Two Points
To find the slope between two distinct points on a graph, such as (x₁, y₁) and (x₂, y₂), utilize the same slope formula emphasized earlier:
Slope (m) = (y₂ – y₁) / (x₂ – x₁)
For example, if you have points (2, 3) and (5, 7), substitute these into the formula:
m = (7 – 3) / (5 – 2) = 4 / 3, meaning the slope of the line connecting these points is 4/3. This straightforward calculation method allows you to dissect **slope-related problems** effectively.
Understanding Different Types of Slope
Slope can exhibit different characteristics, including positive, negative, zero, and undefined slopes. A **positive slope** means the line slants upward from left to right, while a **negative slope** indicates a downward trend. A **zero slope** refers to a horizontal line, and an **undefined slope** occurs in vertical lines. Understanding these distinctions is crucial for interpreting graphs effectively and using slope in data analysis.
Graphical Representation of Slope
Graphically representing slope plays a significant role in visualizing the relationship between two variables. A well-structured chart or graph demonstrates how variables interact through slope changes. The concept of **rise over run** can also be applied visually; as you move along a line, the height you ascend or descend against the distance you travel horizontally illustrates slope.
Visualizing Slope with Graphing Techniques
Several graphical methods can be employed to illustrate slope effectively. For example, Cartesian coordinates allow you to easily plot lines and identify slope change visually. Utilizing different colors for contrasting slopes can also enhance your perception of how steepness varies in graphs. Incorporating tools like graphing calculators or software can help in achieving more precision while representing different trends in graphs.
Graphing Linear Equations
To graph a line using **slope-intercept form**, the equation is expressed as:
y = mx + b
Here, m stands for the slope, while b represents the y-intercept. Understanding this relationship allows for quick sketching and analysis of linear models. By identifying the slope and the y-intercept, you can graph a linear equation and visualize the slope of the line. This technique also aids in understanding trends in the data and evaluating forecasts.
Applications of Slope in Real Life
The concept of slope extends beyond mere mathematics, finding applications across various domains such as economics, engineering, and statistics. In economics, for instance, the slope of demand and supply curves reveals essential insights into market behavior. Similarly, engineers apply linear relationships with slopes to determine load distributions in construction projects, illustrating the practical significance of understanding slope in real-life scenarios.
Calculating Slope in Different Fields
Different fields leverage the calculation methods of slope to extract meaningful insights from data. In statistics and data analysis, slopes enhance predictions of relationships between variables based on observed data points. Understanding the change in rates through slope provides clarity when interpreting complex datasets.
The Role of Gradient in Data Analysis
Data analysts often rely on slope calculations to interpret the strength and direction of relationships within data sets. When evaluating trends, a **steep line** correlates with a stronger relationship, whereas a gradual slope indicates weaker connections. This simple yet fundamental understanding is crucial for analysts deciphering live data or statistical research findings in businesses.
Impact of Slope in Engineering and Physics
In engineering, slope measurements dictate component overload capabilities, while in physics, slope often represents quantities such as speed or acceleration in graphical formats. As engineers or physicists analyze performance and outcomes, their ability to calculate slope accurately becomes critical. Grasping slope’s relevance leads to innovation and efficiency in designs and outcomes.
Slope Techniques in Machine Learning
In machine learning and artificial intelligence, slope calculations apply to various algorithms such as linear regression. By defining the slope and predicting the output variable based on independent variables, models can effectively analyze trends and outcomes. Understanding slope within machine learning adds another layer to the potential outcomes in industry applications, further emphasizing the concept’s relevance.
Conclusion
As we’ve explored, finding the slope of a graph is an invaluable skill across disciplines. The techniques outlined in this guide will help you gain deeper insights into trends and relationships within data. Mastering slope calculations, whether in mathematics or real-life applications like physics, can enhance your analytical capabilities significantly. Remember, a solid understanding of the **slope definition** and its various nuances will pave the way for success.
Key Takeaways
- The slope represents the measure of steepness, depicted as rise over run.
- Different slopes generate various interpretations of graph relationships, including understanding positive, negative, and zero slope.
- Useful graphical tools and techniques enhance visual comprehension of slope.
- Slope calculations are fundamental in fields such as economics, engineering, and machine learning.
- Mastering slope aids in identifying trends, evaluating data, and making informed decisions.
FAQ
1. What is the slope formula?
The slope formula is defined as Slope (m) = (y₂ – y₁) / (x₂ – x₁). This formula helps calculate slope between two points on a graph, representing the vertical change compared to the horizontal change.
2. How do I interpret a zero slope?
A zero slope indicates a horizontal line in a graph. This suggests that there is no change in the vertical variable as the horizontal variable changes—meaning the function is constant across the specified range.
3. What does a positive slope signify?
A positive slope indicates that as one variable increases, so does the other. For example, in a distance-time graph, a positive slope shows increasing velocity.
4. How do slopes apply in real-life analyses?
Slopes enhance our understanding in various fields, such as setting economic market trends, analyzing efficiency in engineering, or predicting outcomes in statistics, making them critical in data analysis.
5. What is the relationship between slope and linear equations?
The slope found in linear equations corresponds directly to the slope-intercept form of an equation (y = mx + b), where m is the slope, defining line steepness and angle against the axes.
6. Can slope change in graphical representations?
Yes, slopes can change within a graph, such as in polynomial or non-linear functions where segments may display varied slopes. This change provides important insights about the relationship dynamics between variables.
7. What tools can aid in slope visualization?
Graphing software, calculators, and digital plotting tools can significantly enhance visualization and calculation for slope, allowing for clearer analysis and representation of relationships in data.